Visual Studio Code を使用した Microsoft Fabric でのデータ サイエンス
VS Code 内の Microsoft Fabric で、データ サイエンスおよびデータ エンジニアリング ソリューションを構築および開発できます。VS Code 用の Microsoft Fabric 拡張機能は、Fabric アーティファクト、Lakehouse、Notebook、ユーザー データ関数を操作するための統合開発エクスペリエンスを提供します。
Microsoft Fabric とは
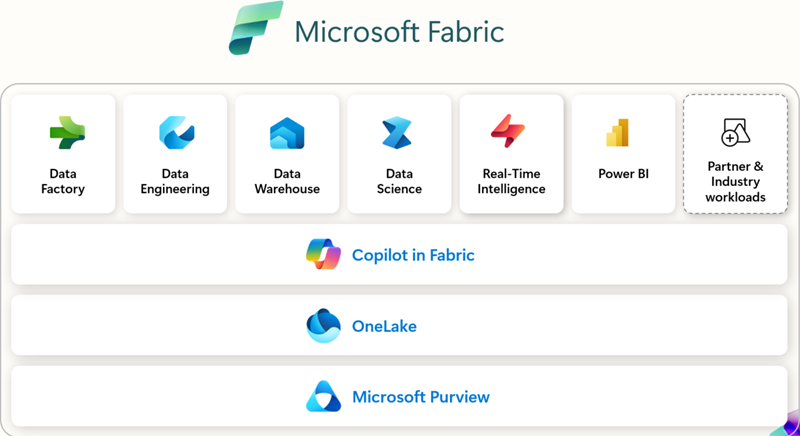
Microsoft Fabric は、エンタープライズ レディなエンドツーエンドの分析プラットフォームです。データ移動、データ処理、取り込み、変換、リアルタイム イベント ルーティング、レポート作成を統合します。これらの機能は、データ エンジニアリング、Data Factory、データ サイエンス、リアルタイム インテリジェンス、データ ウェアハウス、データベースなどの統合サービスによってサポートされます。無料でサインアップして、Microsoft Fabric を 60 日間お試しください。クレジットカードは不要です。
前提条件
VS Code 用 Microsoft Fabric 拡張機能の使用を開始する前に、次のものが必要です。
- Visual Studio Code: 最新バージョンの VS Code をインストールしてください。
- Microsoft Fabric アカウント: Microsoft Fabric ワークスペースへのアクセスが必要です。無料トライアルにサインアップして開始できます。
- Python: VS Code で Notebook、ユーザー データ関数 を使用するには、Python 3.8 以降をインストールしてください。
インストールとセットアップ
拡張機能は、Visual Studio Marketplace から、または VS Code 内から直接見つけてインストールできます。拡張機能ビュー (⇧⌘X (Windows, Linux Ctrl+Shift+X)) を選択し、Microsoft Fabric を検索してください。
使用する拡張機能
| 拡張機能 | 最適な用途 | 主な機能 | 次のような場合に推奨されます | ドキュメント |
|---|---|---|---|---|
| Microsoft Fabric 拡張機能 | 一般的なワークスペース管理、アイテム管理、およびアイテム定義の操作 | - Fabric アイテム (Lakehouse、Notebook、パイプライン) の管理 - Microsoft アカウントへのサインインとテナントの切り替え - 統合またはグループ化されたアイテム ビュー - IntelliSense を使用した Fabric Notebook の編集 - コマンド パレットの統合 ( Fabric: コマンド) |
VS Code から直接、ワークスペース、Notebook、および Fabric 内のアイテムを管理するための単一の拡張機能が必要な場合。 | Fabric VS Code 拡張機能とは |
| Fabric ユーザー データ関数 | カスタム変換とワークフローを構築する開発者 | - Fabric でサーバーレス関数を記述する - ブレークポイントを使用したローカル デバッグ - データ ソース接続の管理 - Python ライブラリのインストール/管理 - 関数を Fabric ワークスペースに直接デプロイする |
自動化またはデータ変換ロジックを構築し、VS Code からのデバッグとデプロイが必要な場合。 | VS Code でユーザー データ関数を開発する |
| Fabric データ エンジニアリング | 大規模データと Spark を扱うデータ エンジニア | - Lakehouse (テーブル、生ファイル) の探索 - Spark Notebook の開発/デバッグ - Spark ジョブ定義の構築/テスト - ローカル VS Code と Fabric 間での Notebook の同期 - スキーマとサンプル データのプレビュー |
Spark、Lakehouse、または大規模データ パイプラインを操作し、ローカルで探索、開発、デバッグしたい場合。 | VS Code で Fabric Notebook を開発する |
はじめに
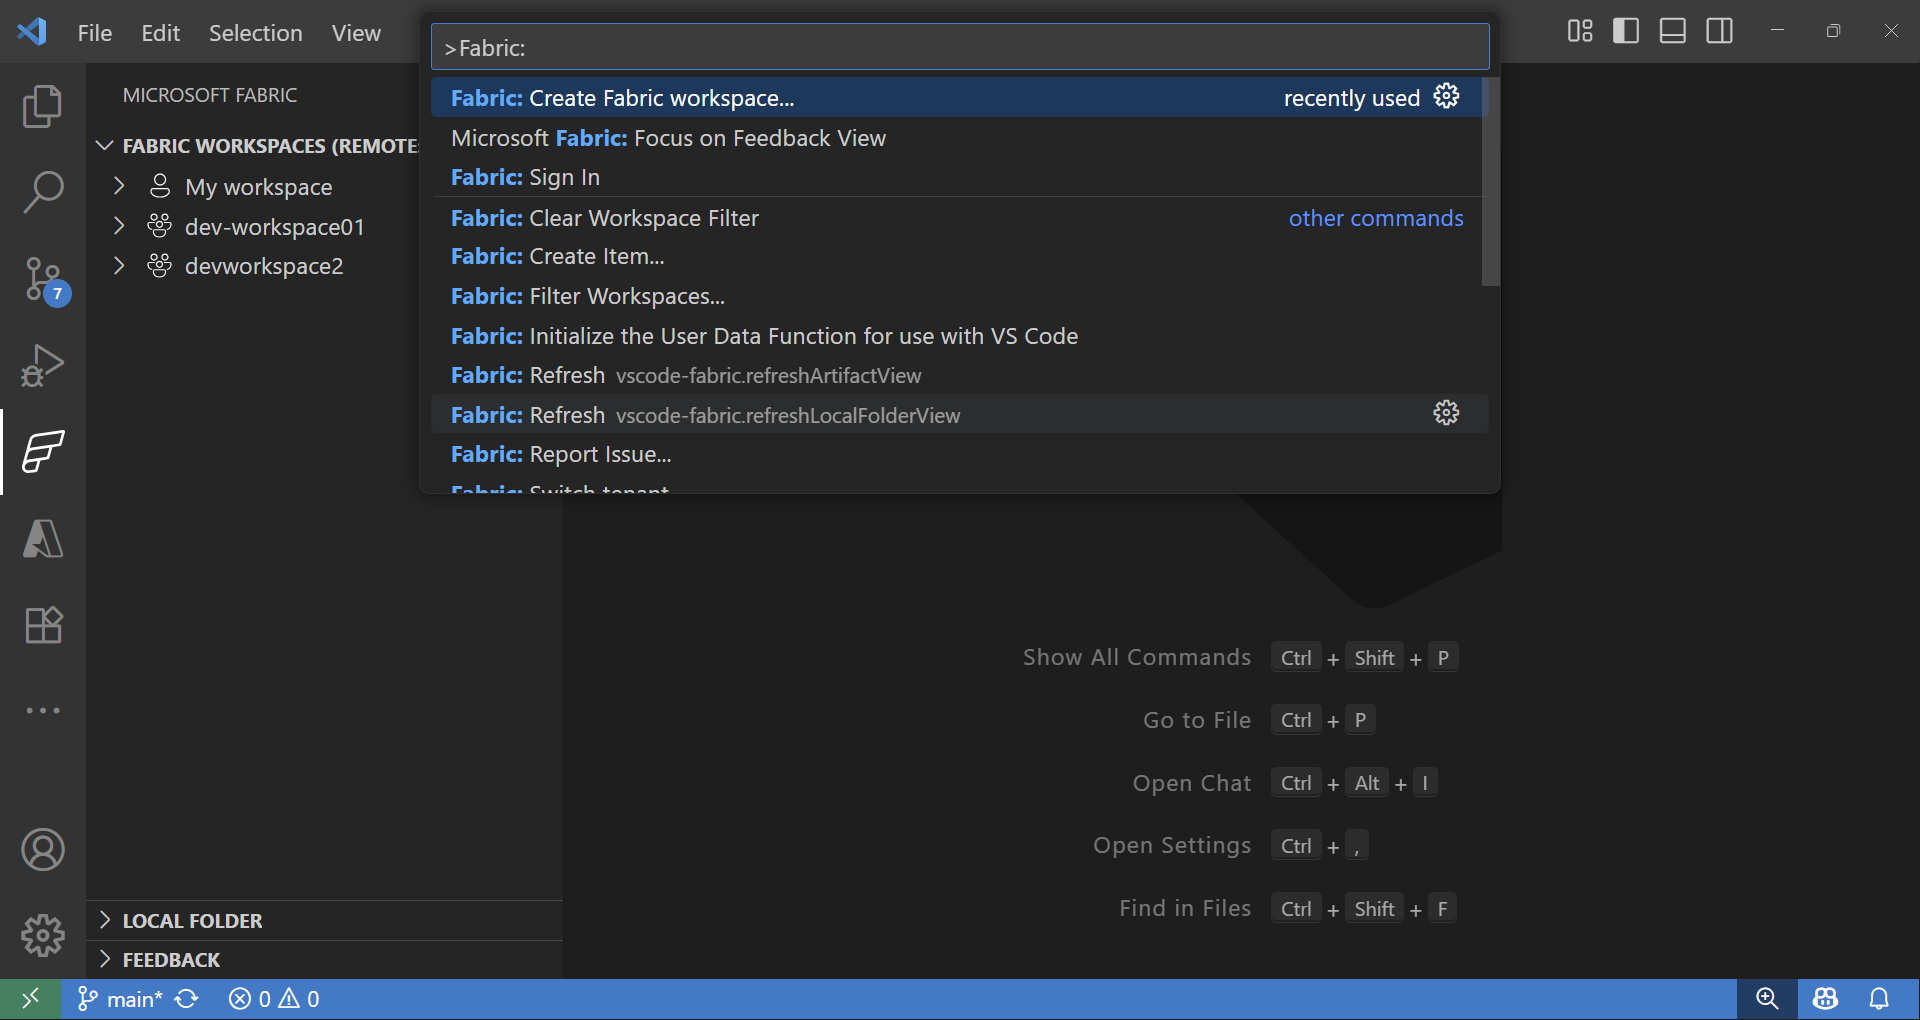
拡張機能のインストールとサインインが完了したら、Fabric ワークスペースとアイテムの操作を開始できます。コマンド パレット (⇧⌘P (Windows, Linux Ctrl+Shift+P)) で **Fabric** と入力すると、Microsoft Fabric 専用のコマンドが一覧表示されます。
Fabric ワークスペースとアイテム エクスプローラー
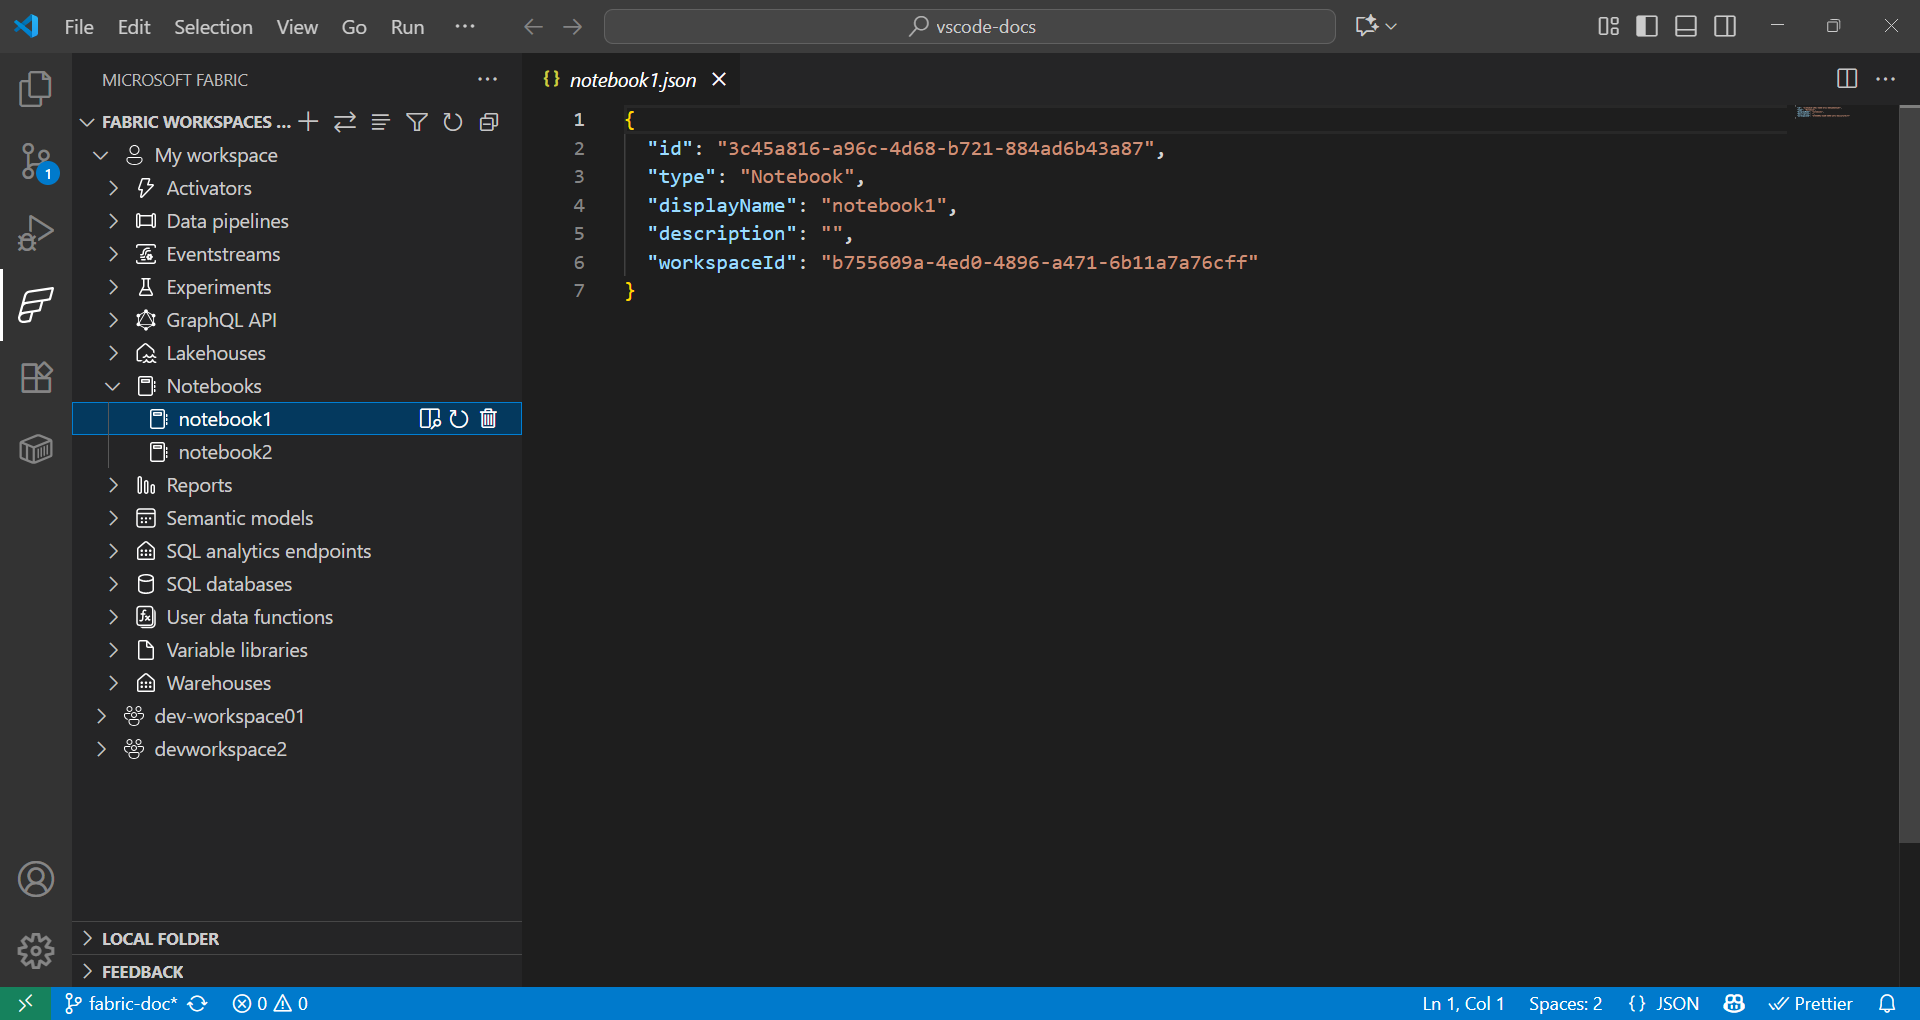
Fabric 拡張機能は、リモートおよびローカルの Fabric アイテムの両方をシームレスに操作する方法を提供します。
- Fabric 拡張機能の **Fabric Workspaces** セクションには、リモート ワークスペースのすべてのアイテムが、種類 (Lakehouse、Notebook、パイプラインなど) ごとに整理されて表示されます。
- Fabric 拡張機能の **Local folder** セクションには、VS Code で開かれている Fabric アイテムのフォルダーが表示されます。VS Code で開かれている各種類の Fabric アイテム定義の構造を反映しています。これにより、ローカルで開発し、変更を現在のワークスペースまたは新しいワークスペースに発行できます。
データ サイエンスのためのユーザー データ関数の使用
-
コマンド パレット (⇧⌘P (Windows, Linux Ctrl+Shift+P)) で、**Fabric: Create Item** と入力します。
-
ワークスペースを選択し、**User data function** を選択します。名前を指定し、**Python** 言語を選択します。
-
Python 仮想環境のセットアップを求める通知が表示されるので、ローカルでセットアップを続行してください。
-
pip installを使用してライブラリをインストールするか、Fabric 拡張機能のユーザー データ関数アイテムを選択してライブラリを追加します。依存関係を指定するためにrequirements.txtファイルを更新します。fabric-user-data-functions ~= 1.0 pandas == 2.3.1 numpy == 2.3.2 requests == 2.32.5 scikit-learn=1.2.0 joblib=1.2.0 -
functions_app.pyを開きます。scikit-learn を使用したデータ サイエンスのためのユーザー データ関数の開発例を次に示します。import datetime import fabric.functions as fn import logging # Import additional libraries import pandas as pd from sklearn.ensemble import RandomForestClassifier from sklearn.preprocessing import StandardScaler from sklearn.model_selection import train_test_split from sklearn.metrics import accuracy_score import joblib udf = fn.UserDataFunctions() @udf.function() def train_churn_model(data: list, targetColumn: str) -> dict: ''' Description: Train a Random Forest model to predict customer churn using pandas and scikit-learn. Args: - data (list): List of dictionaries containing customer features and churn target Example: [{"Age": 25, "Income": 50000, "Churn": 0}, {"Age": 45, "Income": 75000, "Churn": 1}] - targetColumn (str): Name of the target column for churn prediction Example: "Churn" Returns: dict: Model training results including accuracy and feature information ''' # Convert data to DataFrame df = pd.DataFrame(data) # Prepare features and target numeric_features = df.select_dtypes(include=['number']).columns.tolist() numeric_features.remove(targetColumn) X = df[numeric_features] y = df[targetColumn] # Split and scale data X_train, X_test, y_train, y_test = train_test_split(X, y, test_size=0.2, random_state=42) scaler = StandardScaler() X_train_scaled = scaler.fit_transform(X_train) X_test_scaled = scaler.transform(X_test) # Train model model = RandomForestClassifier(n_estimators=100, random_state=42) model.fit(X_train_scaled, y_train) # Evaluate and save accuracy = accuracy_score(y_test, model.predict(X_test_scaled)) joblib.dump(model, 'churn_model.pkl') joblib.dump(scaler, 'scaler.pkl') return { 'accuracy': float(accuracy), 'features': numeric_features, 'message': f'Model trained with {len(X_train)} samples and {accuracy:.2%} accuracy' } @udf.function() def predict_churn(customer_data: list) -> list: ''' Description: Predict customer churn using trained Random Forest model. Args: - customer_data (list): List of dictionaries containing customer features for prediction Example: [{"Age": 30, "Income": 60000}, {"Age": 55, "Income": 80000}] Returns: list: Customer data with churn predictions and probability scores ''' # Load saved model and scaler model = joblib.load('churn_model.pkl') scaler = joblib.load('scaler.pkl') # Convert to DataFrame and scale features df = pd.DataFrame(customer_data) X_scaled = scaler.transform(df) # Make predictions predictions = model.predict(X_scaled) probabilities = model.predict_proba(X_scaled)[:, 1] # Add predictions to original data results = customer_data.copy() for i, (pred, prob) in enumerate(zip(predictions, probabilities)): results[i]['churn_prediction'] = int(pred) results[i]['churn_probability'] = float(prob) return results -
キーボード ショートカット F5 を押して、関数をローカルでテストします。
-
Fabric 拡張機能の **Local folder** で、関数を選択してワークスペースに発行します。

関数を呼び出す方法については、以下を参照してください。
データ サイエンスのための Fabric Notebook の使用
Fabric Notebook は、Microsoft Fabric 内の対話型ワークブックで、コード、可視化、マークダウンを並べて記述および実行できます。Notebook は複数の言語 (Python、Spark、SQL、Scala など) をサポートしており、Fabric 内で OneLake の既存データを使用して、データ探索、変換、モデル開発に最適です。
例
以下のセルは、Spark を使用して CSV を読み取り、pandas に変換し、scikit-learn でロジスティック回帰モデルをトレーニングします。列名とパスは、データセットの値に置き換えてください。
def train_logistic_from_spark(spark, csv_path):
    # Read CSV with Spark, convert to pandas
    sdf = spark.read.option("header", "true").option("inferSchema", "true").csv(csv_path)
    df = sdf.toPandas().dropna()

    # Adjust these to match your dataset
    X = df[['feature1', 'feature2']]
    y = df['label']

    from sklearn.model_selection import train_test_split
    from sklearn.linear_model import LogisticRegression
    from sklearn.metrics import accuracy_score

    X_train, X_test, y_train, y_test = train_test_split(X, y, test_size=0.2, random_state=42)
    model = LogisticRegression(max_iter=200)
    model.fit(X_train, y_train)

    preds = model.predict(X_test)
    return {'accuracy': float(accuracy_score(y_test, preds))}

# Example usage in a Fabric notebook cell
# train_logistic_from_spark(spark, '/path/to/data.csv')
詳細については、Microsoft Fabric Notebooks のドキュメントを参照してください。
Git の統合
Microsoft Fabric は Git 統合をサポートしており、データおよび分析プロジェクト全体でバージョン管理と共同作業を可能にします。Fabric ワークスペースを Git リポジトリ (主に Azure DevOps または GitHub) に接続でき、サポートされているアイテムのみが同期されます。この統合は CI/CD ワークフローもサポートしており、チームがリリースを効率的に管理し、高品質な分析環境を維持できるようにします。

次のステップ
VS Code で Microsoft Fabric 拡張機能のセットアップが完了したら、これらのリソースを探索して知識を深めてください。
コミュニティとの連携とサポートを得るために